Statistics are part of the bedrock of good policy making. We should though recognise that no data is perfect: What we collect, how we collect it, and how it is presented create uncertainties and scope for interpretation. The independence of the organisation collecting the statistics is of fundamental importance.
The UK’s largest independent producer of official statistics is the Office for National Statistics, which is also the recognised national statistical institute. The ONS is responsible for collecting and publishing statistics related to the economy, population, and society at national, regional and local levels.
The ONS conducts the census in England and Wales every 10 years, the most recent of which was conducted in 2021. The results are slowly being published in phases. Naturally the first place to look is what this shows about Croydon.
So far rather little has been published at a sufficient level of detail to draw too many conclusions but we do have rounded population and household estimates for local authorities in England and Wales, by sex and five-year age group. Let’s look at what that means for Croydon.
We have, just, retained our title as the London Borough with the largest population at 390,800, just 1,500 more than Barnet. For comparison the smallest Outer London Borough is Kingston Upon Thames at 168,000. The largest and smallest Inner London Boroughs (excluding City of London) are Newham, and Kensington and Chelsea with 351,100 and 143,400 respectively.
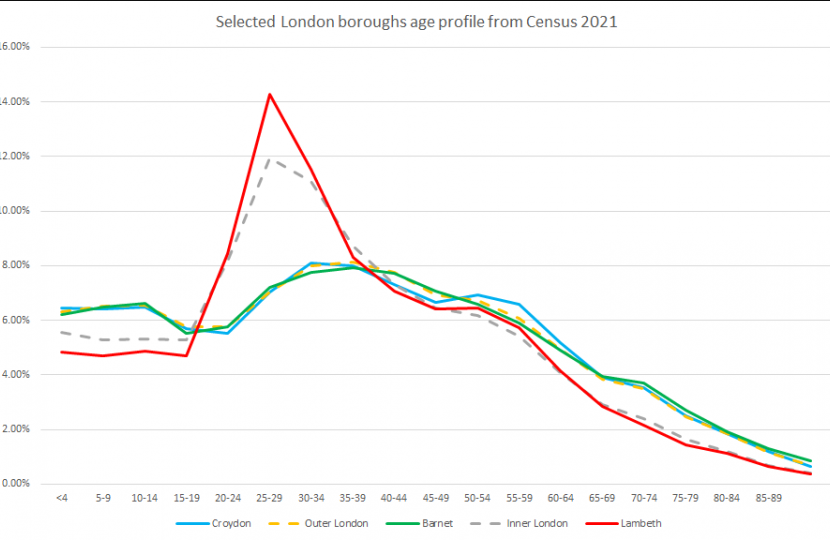
Digging deeper, let’s look at the age distribution of Croydon residents. As illustrated in the graph above, Croydon, and Barnet’s age profile are typical of Outer London Boroughs. Comparing with an average of Inner London boroughs with Lambeth as an example we can see what that means. Inner London boroughs typically have more working age people, and less children and retirement age people.
This has always been so and illustrates how populations move over time. Younger working age people move into Central London. As they grow older, some find partners, produce children and migrate to Outer London and beyond. Some retirees tend to make a similar journey.
These demographic differences have an impact on the Council. More children and older people means, for example, a greater demand for social services. But that is not the only factor. Deprivation and housing are also important factors. We will have to wait a little longer before we can look at those.


